Project Microscopy image analysis tool.
- ⭐ Personal project.
- 📲 Python.
- ✏️ Libraries: CV2, tifffile, os, openpyxl.
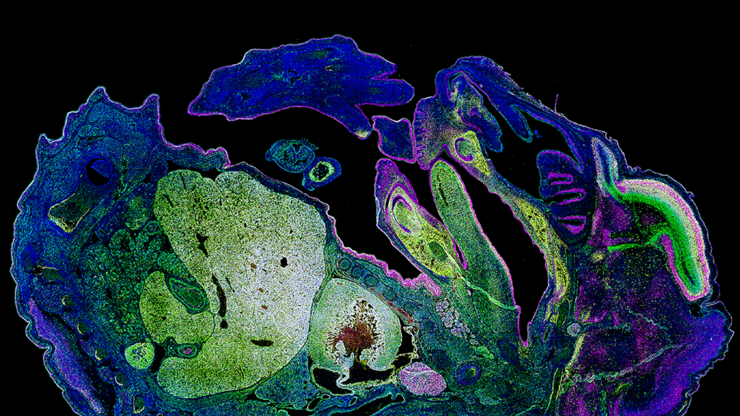
- 📗 Analyzes different protein expression surfaces on different biological tissues.
- 🧑🏫 Returns the user a data sheet with the different proteins contained in the images.
|
OPERATION: the analysis of the aforementioned, in images with tiff format, will result in an Excel sheet in which the percentage of the surface will be represented (taking the total surface of positives in DAPI as 100%)
in which a positive can be seen for each marker ( SOX2, MAP3 and DCX). Internally it will work by applying the OTSU system included in the CV2 library. Additionally, a new filter (GAUSSIAN_C)
can be applied in case the images do not have good quality.
|
The photographs taken should go in the images folder. In this folder, we will have 2 directories, the "WT" directory (control samples) and the "HET" (mutant samples). It is recommended to create a directory for each organoid analyzed within these folders. The file naming format MUST be as follows: SOX2 1-3.tiff Where "SOX2" is the name of the reagent. Where "1" is the organoid number. Where "3" is the section of said organoid. |
For reasons of confidentiality and property of images, I cannot add images as an example.